| |
|

|
Step 2: |
|
Set the
Meter Selector
switch on the power supply to
+20V.
Adjust the
0 to 20V
voltage control to produce 15 volts.
|
Step 3: |
|
Make sure the green banana plug from the interface board
is plugged into the green binding post on the breadboard.
Use a red banana patch cord to connect the
0 to +20V
terminal of the power supply to the red binding post on the breadboard.
With a green cord, connect the
Common
terminal of the power supply (blue binding post)
to the green binding post of the breadboard.
|
Step 4: |
|
Plug your
BNC-banana adapter
into the 6V supply terminals.
Be sure that the prong with the ground bump is plugged
into the negative (black) terminal of the power supply.

|
Step 5: |
|
Plug one end of a BNC patch cord into the adapter.
Plug the other end into P3 on the interface board.
|
Step 6: |
|
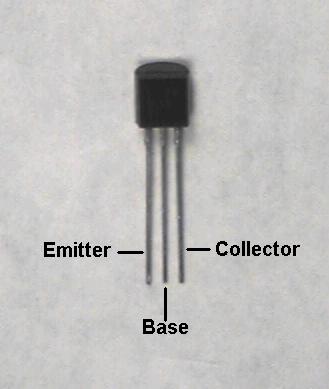
Find a
2N3904 transistor
in your parts kit.
The transistor leads are identified below.

|
Step 7: |
|
Wire the following circuit:
|
| |
|
|
Step 1: |
|
Set the function generator to produce a 100 Hz triangle wave.
|
Step 2: |
|
Unplug the BNC patch cord from the power supply and plug it into
the function generator
MAIN
output.
|
Step 3: |
|
Connect
CH 1
of the oscilloscope to  .
Connect
CH 2
to
.
Connect
CH 2
to  .
.
|
Step 4: |
|
Set the
function generator
AMPLITUDE
control to minimum.
Pull out the
DC OFFSET
control and adjust it so that  .
.
|
Step 5: |
|
Increase the
AMPLITUDE
until the peak-to-peak (p-p) value of
is 4 V.
|
Step 6: |
|
Measure the p-p value of the input,
.
|
Step 7: |
|
Compute the voltage gain of the linear region,
 .
Is this equal to the slope of the linear region of the
transfer curve?
.
Is this equal to the slope of the linear region of the
transfer curve?
|
Question 2: |
|
Show that in the active region,
 .
Is this true for your circuit?
.
Is this true for your circuit?
|

